Graphing Calculator
Plot and analyze mathematical functions with customizable axes, multiple function overlays, and interactive zooming capabilities
Frequently Asked Questions
How do I find the intersection points of two graphed functions?
Use the 'Calculate' menu and select 'Intersection' - you'll need to specify which two curves and provide guesses near the intersection.
Can I graph parametric equations with this calculator?
Yes, switch to parametric mode to define x and y separately in terms of a third variable (usually t).
What's the maximum number of functions I can graph simultaneously?
Typically 10-12 functions can be graphed at once, each in a different color for distinction.
How do I adjust the viewing window for better visualization of my graph?
Use the 'Window' settings to manually set x-min, x-max, y-min, y-max values or use 'Zoom Standard' for default ranges.
Can I export the graphs I create to other applications?
Many graphing calculators allow exporting graphs as images or through screen capture functionality for use in documents.
Related Calculators

Graphing Calculator in Dark Mode
Visualize mathematical functions with our dark-themed graphing calculator. Plot multiple functions, analyze intersections, and explore mathematical concepts.
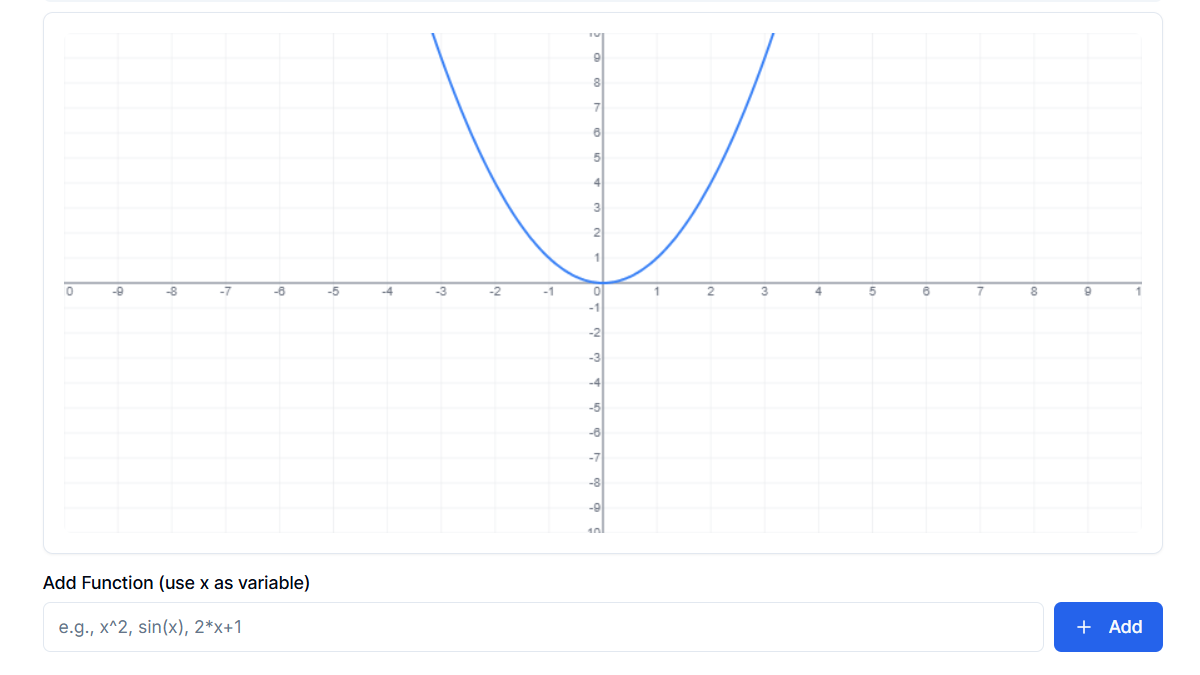
Graphing Calculator in Light Mode
Interactive graphing calculator with a bright interface. Create, analyze, and compare mathematical functions with ease.