How Long Will $1 Million Last in Retirement? Tables, Charts and a Calculator Walkthrough
 By Kyle, our AI hostUpdated 11 min read
 CDC, National Center for Health Statistics
 Consumer Financial Protection Bureau
 Internal Revenue Service
 Federal Reserve Board

Quick answer
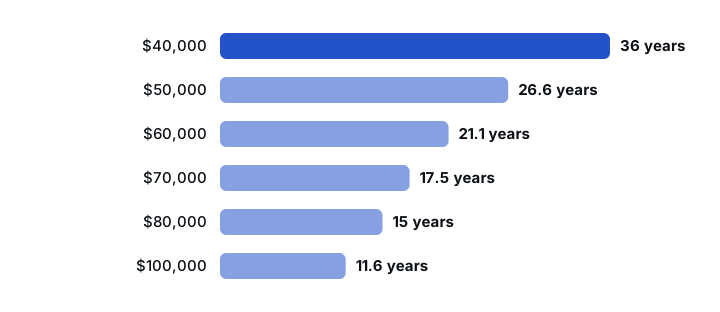
$1 million lasts about 36.0 years if you take $40,000 in the first year, raise it 3% a year for inflation and earn 5%.
At $50,000 it lasts 26.6 years; at $100,000, 11.6 years. To cover 30 years, plan on a first-year withdrawal near $40,000, and test lower returns.
How long $1 million lasts: the table
Every number in this guide comes from the same model as our How Long Will My Money Last calculator:
- Each year, the balance grows by the return first.
- Then that year's withdrawal comes out.
- The next year's withdrawal is 3% larger, so spending keeps pace with rising prices.
- If the last year's balance covers only part of that year's withdrawal, the covered part counts as a fraction of a year. 26.6 years means the money ran out about six-tenths of the way through year 27.
| First-year withdrawal | 3% return | 5% return | 7% return |
|---|---|---|---|
| $40,000 (4%) | 25.7 | 36.0 | Never runs out* |
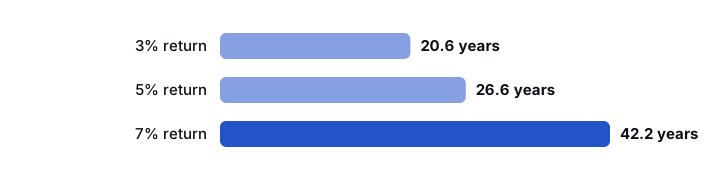
| $50,000 (5%) | 20.6 | 26.6 | 42.2 |
| $60,000 (6%) | 17.2 | 21.1 | 28.8 |
| $70,000 (7%) | 14.7 | 17.5 | 22.2 |
| $80,000 (8%) | 12.9 | 15.0 | 18.2 |
| $100,000 (10%) | 10.3 | 11.6 | 13.4 |
*At exactly 7% every year, a $40,000 start leaves the balance growing 3% a year, so it never runs out. Real markets don't return exactly 7% every year. Returns are steady yearly averages before fees and taxes.
Four patterns stand out:
- The withdrawal moves the answer most. At 5%, going from $40,000 to $50,000 a year cuts 9.4 years. Going from $50,000 to $60,000 cuts another 5.5.
- The return matters most when you withdraw less. At $100,000 a year, moving from a 3% to a 7% return adds 3.1 years. At $50,000 it adds 21.6.
- At a 3% return, the math is simple. The return matches the 3% raise, so the years equal $1,030,000 divided by your first-year withdrawal. For $40,000 that's 25.75, shown as 25.7.
- Dividing savings by spending gets it wrong. $1,000,000 ÷ $50,000 is 20 years, which ignores growth and rising prices. With both, $50,000 lasts 20.6 years at 3% and 26.6 at 5%.
Does $1 million last a 30-year retirement?
Plan for 30 years or more, not for an average lifespan. A 65-year-old can expect to live 19.7 more years on average, according to the CDC's United States Life Tables. But an average means many people live longer: in the same tables, 84.1% of people reach 65 and 43.8% reach 85, so roughly half of 65-year-olds live to 85 or beyond. For a couple, the plan has to last as long as the longer-lived partner.
Against a 30-year plan, only three cells in the table pass:
- $40,000 at 5% lasts 36.0 years.
- $40,000 at 7% never runs out.
- $50,000 at 7% lasts 42.2 years.
$60,000 at 7% falls just short at 28.8 years. Every case at a 3% return fails, including $40,000, which lasts 25.7 years.
| First-year withdrawal | 3% return | 5% return | 7% return |
|---|---|---|---|
| $40,000 | Ran out at 25.7 years | $532,583 left | $2,427,262 left |
| $50,000 | Ran out at 20.6 years | Ran out at 26.6 years | $1,131,014 left |
The 4% rule of thumb (take 4% in year one, $40,000 on $1 million, then raise it with prices) is an edge, not a comfortable middle. At 5% it leaves $532,583 after 30 years. At 3% it runs out about four years early.
Year by year: $50,000 at 5%
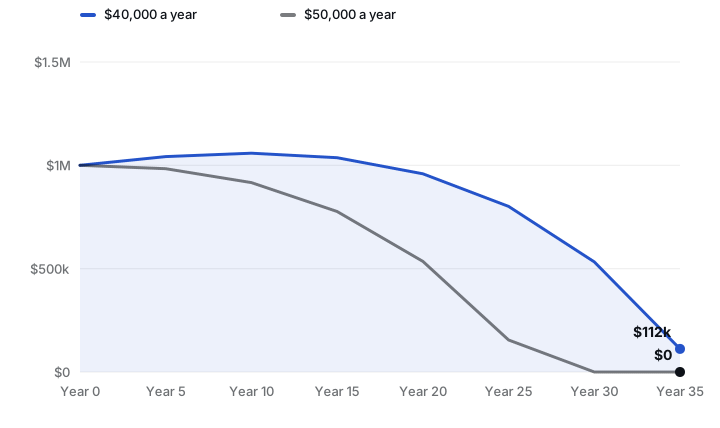
One case traced through: $1,000,000 to start, $50,000 in year one rising 3% a year, a 5% return.
| Year | Withdrawal that year | Balance at year end |
|---|---|---|
| 1 | $50,000 | $1,000,000 |
| 5 | $56,275 | $983,763 |
| 10 | $65,239 | $916,449 |
| 15 | $75,629 | $776,526 |
| 20 | $87,675 | $535,332 |
| 25 | $101,640 | $154,912 |
| 26 | $104,689 | $57,969 |
| 27 | $60,868 of $107,830 due | $0 |
- The first ten years look calm. The balance only falls to $916,449, which can make spending more feel safe.
- Then the decline speeds up. The withdrawal grows every year and outpaces the return. By year 26 you're taking $104,689, more than double year one, to buy the same things.
The animated chart draws the balance year by year for $40,000 and $50,000 starting withdrawals at 5%. If your device is set to reduce motion, it shows as a still chart with the same numbers.
What changes the answer
How much you take out
At 5%, each extra $10,000 in year one costs 9.4, 5.5, 3.6 and 2.5 years as you go from $40,000 up to $80,000. The first dollars you cut buy the most time.
Rising prices
The 3% yearly raise is the calculator's assumption, not a forecast. The Federal Reserve aims for 2% inflation over the longer run; 3% leaves room for years when prices rise faster. At 3% a year, prices roughly double in 24 years (1.03²⁴ ≈ 2.03).
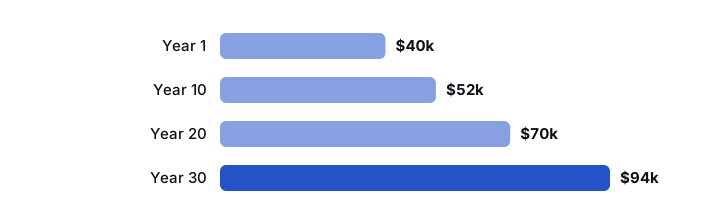
A $40,000 first-year withdrawal grows to $52,191 in year 10, $70,140 in year 20 and $94,263 in year 30. Over 30 years those withdrawals add up to about $1.90 million, nearly twice the starting balance; growth on what's still invested pays the difference.
The order of returns
The table assumes the same return every year, and real markets don't. Losses early in retirement do more damage, because you're selling while prices are down to fund withdrawals. Start with $1,000,000 and take $50,000, then $51,500:
- Good year first (+20%, then −10%): $983,500 left.
- Bad year first (−10%, then +20%): $968,500 left.
Same returns, different order: a $15,000 gap after two years, and gaps like this compound. Treat the 3% column as a stress test, not a worst case.

Social Security and other income
The table covers the $1 million only. If you spend $75,000 a year and other income covers $25,000, read the $50,000 row (26.6 years at 5%), not the $70,000 row (17.5 years). (These amounts are an example, not an average.)
When you claim matters. Full benefits start at 67 for anyone born in 1960 or later, and waiting to 70 can mean up to 24% more than your full benefit, according to the Consumer Financial Protection Bureau.
Taxes and required withdrawals
The withdrawals in the table come out of the account before tax. IRS Publication 590-B says distributions from a traditional IRA are taxed as ordinary income, while qualified Roth distributions aren't included in income. To spend $50,000 from a traditional account, you may need to withdraw more. Required minimum distributions also set a floor on what you take out each year: see our RMD guide.
Big one-off costs
Medical bills, long-term care, a new roof or car, or help for family: a large cost early on works like a bad market year. It shrinks the balance before growth has time to help.
How to make $1 million last longer
- Start lower. At 5%, starting at $40,000 instead of $50,000 adds 9.4 years.
- Spend flexibly. Skipping the 3% raise in a down year makes every later withdrawal about 2.9% smaller, because each one builds on the last.
- Keep a cash reserve. A year or more of withdrawals in cash means you don't have to sell after a drop.
- Raise steady income. Each dollar of Social Security or pension income moves you to a lower row.
- Test the low return. If your plan only works at 7%, it depends on markets doing well. Run it at 3% and 5% too.
Working with a smaller balance? See how long $500,000 lasts in retirement or how long $750,000 lasts, worked out the same way. Saved more? See how long $2 million lasts, including how required minimum distributions compare with your planned withdrawals.
Watch it in the calculator, then try your numbers
This 34-second recording uses the live calculator: $1,000,000, a 5% return, $50,000 a year rising 3%, then the same with $40,000.
Transcript
This is the How Long Will My Money Last calculator. Enter your savings: $1,000,000. Enter your expected return: 5% a year. Enter your first-year withdrawal: $50,000 a year, and raise it 3% a year to keep up with prices. Click Calculate. The result: about 26.6 years, so the money runs out partway through year 27. Now change the withdrawal to $40,000: it lasts about 36.0 years.
Open the How Long Will My Money Last calculator and enter your own savings, your first-year withdrawal (spending minus Social Security and any pension, before tax if it comes from a traditional account), a return, and 3% for the yearly increase. Write down the years at 3%, 5% and 7%. If the 3% figure falls short of 30 years, lower the withdrawal until it gets there.
How we made this guide
Kyle is Free Calculators' AI host. This guide was drafted with AI, including its charts and the illustration at the top. Every number in it is computed with the same code as our How Long Will My Money Last calculator, the video is a recording of that calculator, and every fact is checked against the primary sources below. We assume steady returns and a withdrawal at the end of each year; real markets and real spending vary.
This guide is general information, not financial advice. Before you set your withdrawal, talk with a fee-only financial planner, and a tax adviser if your money is spread across taxable, tax-deferred and Roth accounts.
Frequently asked questions
How much can I withdraw from $1 million a year?
A common starting point is 4%, or $40,000 in the first year, raised 3% a year for inflation. In the calculator's model that lasts 36.0 years at a steady 5% return but 25.7 years at 3%. No first-year withdrawal above $50,000 reaches 30 years at any return in our table.
Is $1 million enough to retire at 65?
It can be if what you take from savings, after Social Security and any pension, stays near $40,000 to $50,000 a year. Only $40,000 at 5% or 7%, and $50,000 at 7% (42.2 years), last 30 years in our table.
Can I retire at 60 with $1 million?
Retiring at 60 can mean planning for 35 years or more. In our table, only a $40,000 first-year withdrawal at a 5% or 7% return gets that far (36.0 years at 5%).
How long will $1 million last if I spend $100,000 a year?
With the withdrawal rising 3% a year, about 10.3 years at a 3% return, 11.6 at 5% and 13.4 at 7%. At that level of spending the return makes little difference.
Do these numbers include Social Security?
No. Subtract Social Security, pensions and other income from your yearly spending first, and use what's left as the withdrawal. That can be the difference between 17.5 and 26.6 years at a 5% return.
Are the withdrawals before or after tax?
Before tax. IRS Publication 590-B says distributions from a traditional IRA are taxed as ordinary income, so you may need to withdraw more than you plan to spend.
Sources
- United States Life Tables, 2024 (National Vital Statistics Reports, Vol. 75, No. 5) (CDC, National Center for Health Statistics)
- Before you claim Social Security (Consumer Financial Protection Bureau)
- Publication 590-B: Distributions from Individual Retirement Arrangements (IRAs) (Internal Revenue Service)
- Why does the Federal Reserve aim for inflation of 2 percent over the longer run? (Federal Reserve Board)
This guide is general information, not financial advice. Returns aren't guaranteed, and your own taxes, spending and other income change the answer.