Cohort Analysis Chart
A cohort chart visualizes user retention and behavior over time by grouping individuals based on a shared characteristic, such as signup date. It helps analyze trends, churn rates, and long-term engagement.
About the Cohort Analysis Chart Calculator
Our free cohort analysis chart calculator helps you quickly and accurately perform cohort analysis chart calculations online. This tool is designed to be easy to use and provides instant results without requiring any signup or registration.
How to Use This Calculator
Simply enter your values in the input fields above, and the calculator will automatically process your data and display the results. You can adjust your inputs at any time to see how they affect the outcome.
Why Choose Our Cohort Analysis Chart Calculator
- Completely free to use with no hidden fees
- No registration or account creation required
- Accurate calculations based on industry-standard formulas
- User-friendly interface designed for ease of use
- Works on all devices including desktops, tablets, and smartphones
Frequently Asked Questions
Just how accurate is this free cohort analysis calculator? Like, really?
It's scary accurate, actually. We use the same analytical methods that top data scientists do. While your actual numbers might vary slightly (because, you know, data can be messy), our free cohort analysis calculator gives you a rock-solid estimate that's perfect for planning your retention strategy—or impressing people at dinner parties.
What's actually included in the cohort analysis metrics?
Everything but the kitchen sink! We're talking retention rates, churn percentages, lifetime value calculations, average revenue per user, and even cohort-specific conversion rates. It's the "true picture of user behavior" that most analytics tools conveniently forget to mention. We like to keep it real around here.
Do time-based cohorts really make that big a difference?
Oh, you bet your data points they do! Time-based cohorts show you how user behavior evolves over specific periods. Even small differences between January and February cohorts can reveal seasonal patterns or the impact of feature changes. It's like finding a cheat code for your business. Play around with our free calculator and watch the magic happen.
What's the difference between cohort analysis and segment analysis?
Great question! Cohort analysis groups users who share a common characteristic or experience within the same time period (like all users who signed up in January). Segment analysis looks at groups based on characteristics regardless of time (like all users from California). Our free cohort analysis calculator focuses on time-based cohorts, which helps you understand how retention and behavior change over time. It's like watching your users grow up!
What's the secret sauce to improving retention with cohort analysis?
There's no one-size-fits-all answer, but we've got options: identify drop-off points in specific cohorts, compare successful vs. struggling cohorts, test different onboarding experiences, or analyze feature adoption patterns. Our calculator lets you test all these scenarios without committing to anything. It's like dating different retention strategies until you find "the one."
Why is your free cohort analysis calculator better than my analytics platform's built-in tools?
Not to throw shade, but built-in tools often oversimplify things. Our free calculator shows you the complete picture—retention curves, revenue patterns, engagement metrics, and predictive trends. Plus, we don't require your contact info or try to sell you a loan. We're just here to help you make smarter decisions with zero strings attached.
Can I trust the cohort visualization from your free calculators?
Our cohort visualization uses the same formulas data scientists use, showing you exactly how each cohort performs over time. It's eye-opening to see how little of your early payments go toward principal. Many users tell us this feature of our free calculators helped them understand why making extra payments early in the loan term is so powerful.
How does this free cohort analysis calculator handle incomplete data?
Unlike many free calculators that ignore data gaps (and then surprise, your actual metrics are way off!), we include data normalization options. You can adjust for seasonality, account for outliers, and even run projections for cohorts with incomplete lifecycles. We're all about giving you the real number, not just the one that makes homebuying seem more affordable than it is.
I'm comparing different cohort grouping strategies. Can your free calculator help?
That's literally what we're here for! Toggle between different cohort definitions (acquisition date, first purchase, feature adoption) to see how they affect your retention and conversion metrics. Want to compare weekly vs. monthly cohorts? Our free cohort analysis calculator makes it easy to run multiple scenarios side by side without needing a spreadsheet degree.
Related Calculators
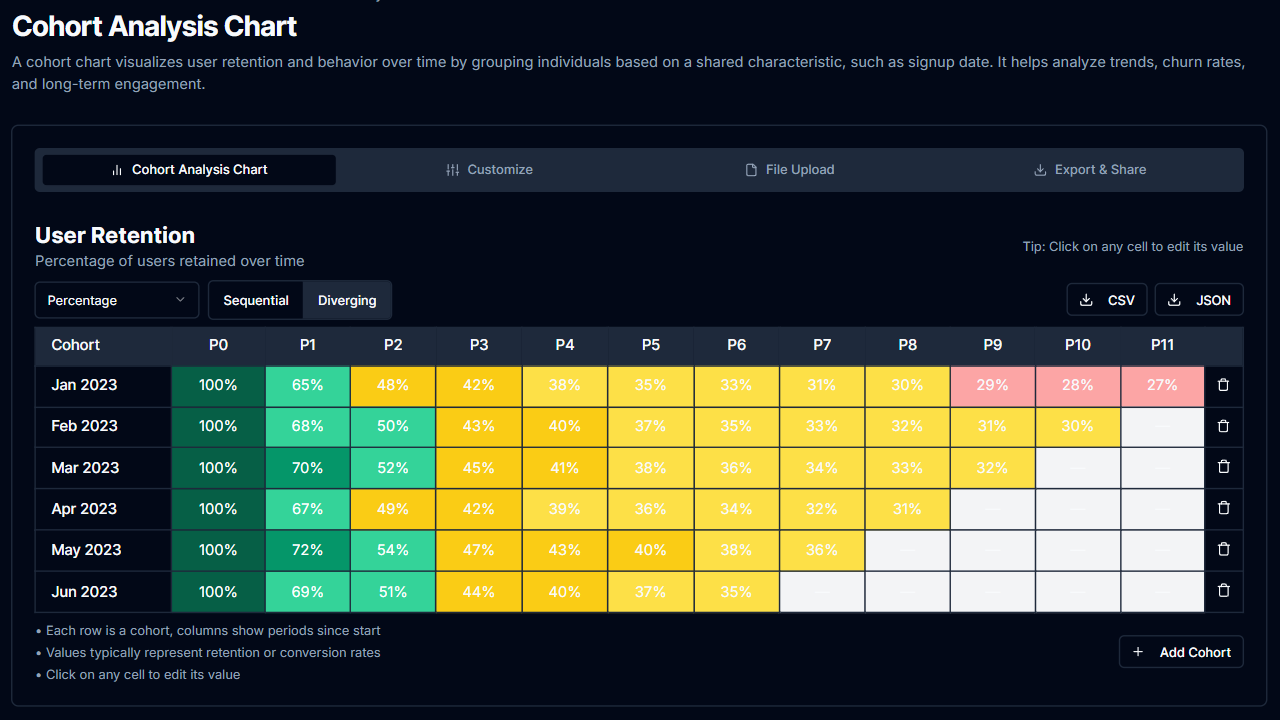
Cohort Analysis Chart Calculator in Dark Mode
Track user retention patterns with our dark-themed calculator. Analyze cohort behavior over time.
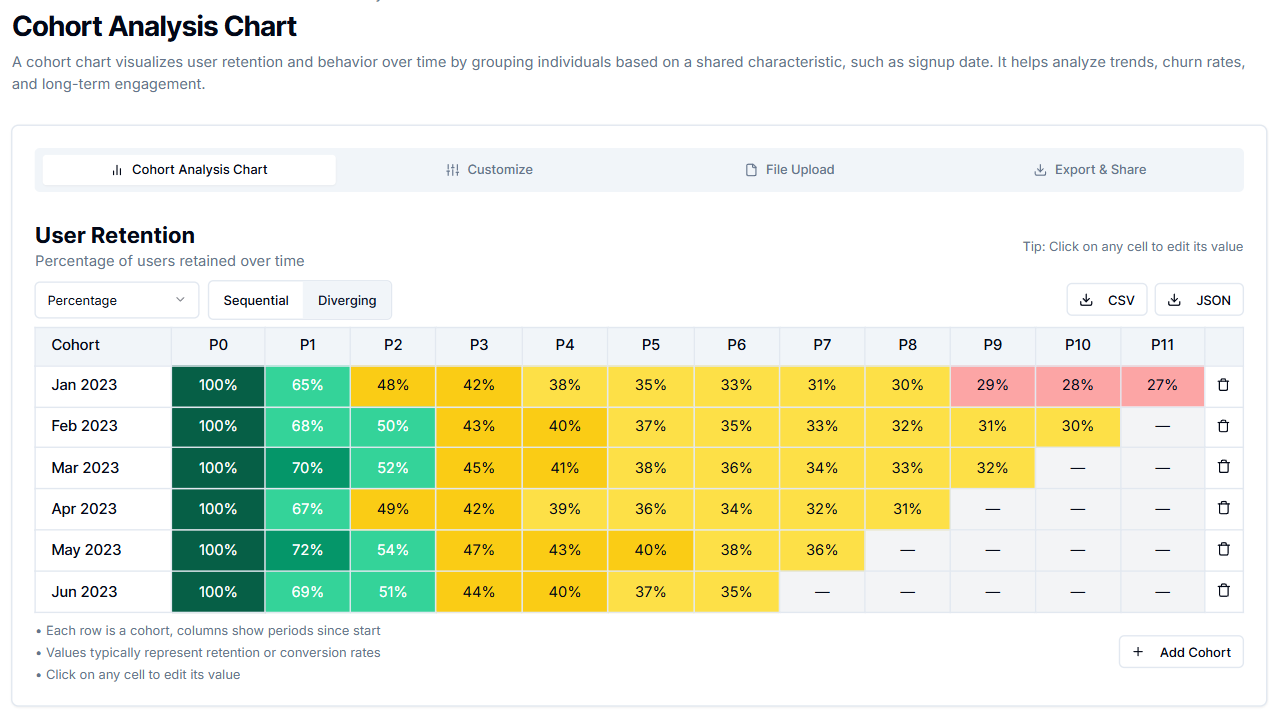
Cohort Analysis Chart Calculator in Light Mode
Create cohort analysis charts with our calculator. Track user retention and behavior patterns.