Radar Chart
Create customizable radar charts for competitive analysis, performance evaluation, and multi-variable comparison with interactive data points and exportable graphics
About the Radar Chart Calculator
Our free radar chart calculator helps you quickly and accurately perform radar chart calculations online. This tool is designed to be easy to use and provides instant results without requiring any signup or registration.
How to Use This Calculator
Simply enter your values in the input fields above, and the calculator will automatically process your data and display the results. You can adjust your inputs at any time to see how they affect the outcome.
Why Choose Our Radar Chart Calculator
- Completely free to use with no hidden fees
- No registration or account creation required
- Accurate calculations based on industry-standard formulas
- User-friendly interface designed for ease of use
- Works on all devices including desktops, tablets, and smartphones
Frequently Asked Questions
What exactly is a radar chart and when should I use one?
A radar chart (also known as a spider or web chart) displays multivariate data across multiple quantitative variables, represented on axes starting from the same point. They're ideal for comparing entities across multiple variables simultaneously, showing strengths and weaknesses at a glance. Use them when you need to compare performance across 3-10 dimensions, evaluate balance/imbalance in datasets, or visualize before/after scenarios.
How many variables can I effectively display on a radar chart?
While technically you can add many variables, radar charts work best with 3-10 dimensions. Too few dimensions (1-2) don't leverage the chart's strengths, while too many (10+) create visual clutter and make the chart difficult to interpret. Our calculator automatically optimizes the spacing and layout based on your variable count to ensure maximum readability.
Can I compare multiple datasets on the same radar chart?
One of the radar chart's strengths is comparing multiple entities across the same dimensions. Our calculator allows you to add up to 5 different datasets on the same chart, each with a distinct color and transparency level. This makes it perfect for competitive analysis, before/after comparisons, or tracking changes over time. Just use the 'Add Dataset' feature in our calculator.
How do I handle variables with different scales in a radar chart?
Great question! Variables with different scales need normalization to make meaningful comparisons. Our calculator handles this automatically by offering three normalization methods: Min-Max scaling (0-100%), Z-score standardization, or custom range mapping. You can also manually set the scale for each axis if you have specific requirements. This ensures all your variables contribute equally to the visual representation.
What's the difference between filled and unfilled radar charts?
Filled radar charts (where the area inside the line is colored) emphasize the overall 'footprint' of your data and make it easier to compare the total area between different datasets. Unfilled charts (just the outline) focus more on the individual values and specific points of comparison. Our calculator lets you toggle between both styles with a single click, and even adjust the fill opacity to find the perfect balance for your specific data story.
Can I customize the appearance of my radar chart?
Our free radar chart calculator offers extensive customization options. You can adjust colors, line thickness, fill opacity, axis labels, grid lines, legend position, and even the chart's orientation. We also offer pre-designed themes optimized for different contexts like business presentations, academic papers, or creative portfolios. All customizations can be previewed in real-time before you download or share your chart.
How can I share or export my radar chart?
Once you've created your perfect radar chart, you can export it in multiple formats including PNG, SVG, PDF, or interactive HTML. The SVG and PDF options are particularly useful for high-quality prints or publications. You can also generate a shareable link that allows others to view and even edit your chart (if you enable that option). For presentations, we offer direct PowerPoint and Google Slides export with just one click.
Are there any common mistakes to avoid when creating radar charts?
The most common pitfalls include using too many variables (creating a messy 'starfish' effect), improper scaling that distorts comparisons, poor axis ordering that creates misleading shapes, and using radar charts for time-series data (where line charts would be better). Our calculator helps you avoid these mistakes with built-in warnings and suggestions. We'll alert you if your chart might be misinterpreted and offer alternatives when appropriate.
Can I use this radar chart calculator for academic or professional work?
Definitely! Our radar chart calculator is used by professionals across industries including business analysis, academic research, product development, and performance evaluation. The charts you create are publication-quality and can be exported in formats suitable for journals, reports, or presentations. We even provide citation information if you need to reference the tool in academic work.
Related Calculators
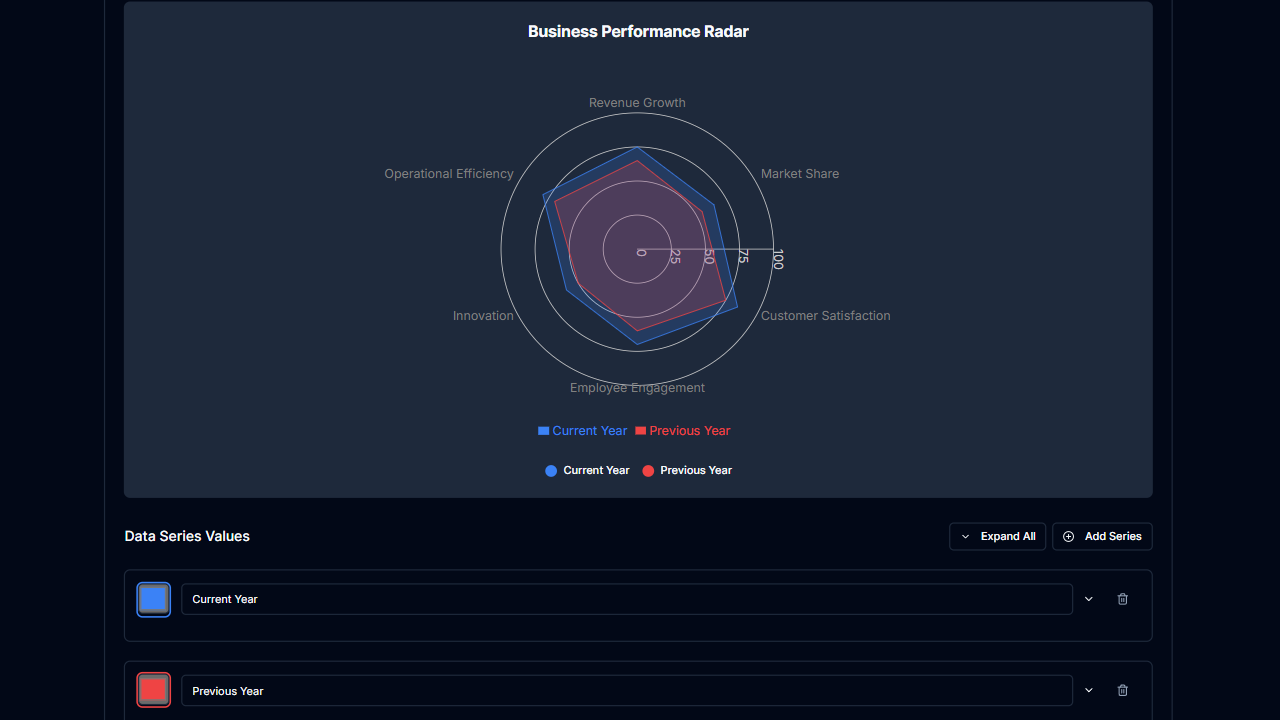
Radar Chart Calculator in Dark Mode
Create customizable radar charts with our dark-themed calculator. Multi-variable comparison tool.
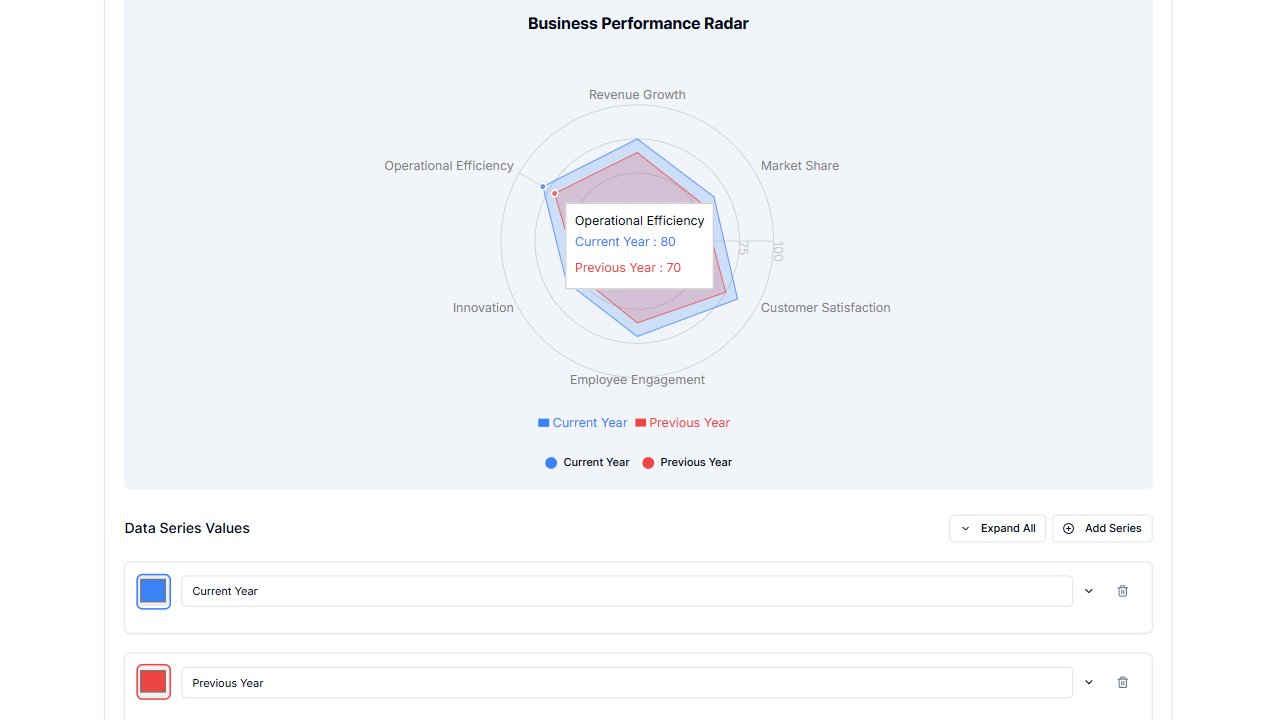
Radar Chart Calculator in Light Mode
Create radar charts with our calculator. Perfect for competitive analysis and performance evaluation.